Global Operations Evidence

Global evidence.
Operational context.
Better decisions.

HUDSON structures documented operational evidence to help warehouse, logistics and industrial teams compare performance, identify relevant operating peers and explore improvement opportunities.

1
Service Level OTIF, Fill Rate, On-Time Delivery, Order Accuracy
Learn more
Service & Quality Metrics

Service Level / taux de service, OTIF (On Time In Full), Fill Rate / taux de disponibilité, Perfect Order Rate, On-Time Delivery, Order Accuracy, Backorder Rate, Stockout Rate, Return Rate, taux d'erreur de préparation, taux de commandes complètes.

2
Inventory Turnover, DIO, Safety Stock, Inventory Accuracy
Learn more
Inventory Management

Inventory Turnover / rotation des stocks, Days Inventory Outstanding (DIO), Stock Coverage, Average Inventory, Safety Stock, Inventory Accuracy, Obsolescence Rate, Working Capital immobilisé, SKU Capacity.

3
Demand Planning Forecast Accuracy, MAPE, WAPE, Forecast Bias
Learn more
Forecasting Performance

Forecast Accuracy, Forecast Error, MAPE, WAPE (Weighted Absolute Percentage Error), Forecast Bias, Demand Planning Accuracy, Forecast Improvement, variation forecast vs actual.

4
Lead Times Order Cycle, Supplier Lead Time, Dock-to-Stock
Learn more
Time Performance

Order Lead Time, Order Cycle Time, Delivery Lead Time, Supplier Lead Time, Replenishment Lead Time, Dock-to-Stock Time, Picking Time, Processing Time, Manufacturing Lead Time.

5
Logistics Costs Cost/Order, Cost/Pick, Cost/Pallet, Cost/Unit
Learn more
Cost Performance

Logistics Cost per Unit, Cost per Order, Cost per Shipment, Cost per Line, Cost per Pick, Fulfilment Cost per Order, Warehouse Cost per Order, Transportation Cost, Cost-to-Serve, coût de stockage, coût de main-d'œuvre, coût logistique / CA, coût par palette manipulée.

6
Productivity Picks/FTE, Orders/FTE, Output/Operator
Learn more
Labour Performance

Picks per Hour, Lines per Hour, Orders per Hour, Units per Hour, Cases per Hour, Pallets per Hour, Output per Operator, Orders per FTE, Picks per FTE, Productivity Increase %, heures de travail par commande.

7
Throughput Orders/hour, Pallets/hour, Peak Throughput
Learn more
Processing Capacity

Orders/hour, Order Lines/hour, Units/hour, Cases/hour, Pallets/hour, Parcels/hour, Containers/hour, Daily Throughput, Peak Throughput, capacité nominale, capacité réellement observée, Peak vs Average.

8
Storage Capacity Pallets/m², Density, Space Utilization
Learn more
Density & Space Performance

Pallet Positions, Tote Locations, Bin Locations, SKU Capacity, Storage Capacity, Pallets/m², Pallets/m³, Storage Density, Space Utilization, Capacity Utilization, Floor Area, Racking Height.

9
Labour FTE, Labor Reduction %, Output per Employee
Learn more
Workforce Performance

Nombre de FTE, Operators / shift, Labor Reduction %, FTE Reduction, Labor Hours, Labor Cost, Output per Employee, Productivity per Operator, postes supprimés/redéployés, dépendance à la main-d'œuvre temporaire.

10
Quality Picking Accuracy, Error Rate, Uptime
Learn more
Operational Quality

Picking Accuracy, Order Accuracy, Error Rate, Damage Rate, Returns, Inventory Accuracy, Mis-pick Rate, Perfect Order Rate, Uptime, Downtime.

11
Automation AS/RS, AMR, AGV, GTP, Robotics, WMS
Learn more
Technology & Automation

AS/RS pallet, AS/RS miniload, AutoStore / cube storage, Goods-to-Person (GTP), AMR, AGV, Shuttle, Automated Picking, Pick-to-Light, Voice Picking, Sortation, Conveyors, Automated Palletizing, Robotics, WMS / WES / WCS. Pour chaque technologie : capacité, débit, surface, nombre de robots, stations, opérateurs, productivité, disponibilité, gains avant/après.

12
Transformation Before/After, ROI, Payback, Annual Savings
Learn more
Change & Investment Performance

Throughput +62 %, Labor -31 %, Storage capacity +45 %, Space requirement -38 %, Order accuracy 98,7 % → 99,8 %, Lead time 18 h → 7 h, Inventory -22 %, Logistics cost/order -17 %, CAPEX, Payback Period, ROI, Operating Cost Reduction, Labor Cost Savings, Annual Savings, Total Cost of Ownership.

The database

From global evidence
to operational performance.

Public operational evidence is fragmented across case studies, operator publications, technical documents, reports, professional media and other sources.

HUDSON turns that fragmented material into structured operational records without treating collection itself as validation.

Global operational data and warehouse evidence
1
Collect Discover sources

Identify operational material with potential evidence value.

Harvester is deliberately broad at discovery stage. A collected web page remains an unverified candidate, not a validated benchmark.
2
Structure Extract candidates

Facilities, interventions and quantitative observations.

Farmer converts usable source material into structured candidates while keeping unknown values unknown rather than filling missing context.
3
Resolve Investigate evidence

Clarify source, scope, unit and facility identity.

Evidence Resolver can investigate incomplete or ambiguous records and propose repairs, but it cannot validate evidence or promote a record by itself.
4
Review Control benchmark use

Explicit review before an observation becomes benchmark-ready.

Reviewer is the promotion gate. Source, metric, unit, scope and comparability must be explicitly checked before a quantitative observation can enter the validated benchmark layer.

Evidence.
Context.
Optimization.

The objective is not to accumulate articles. It is to build a structured evidence layer in which one facility can be documented by several sources, several observations and several interventions while provenance remains visible.

Comparable warehouse and distribution operation
Operational comparability

Similar operations do not always belong to the same industry.

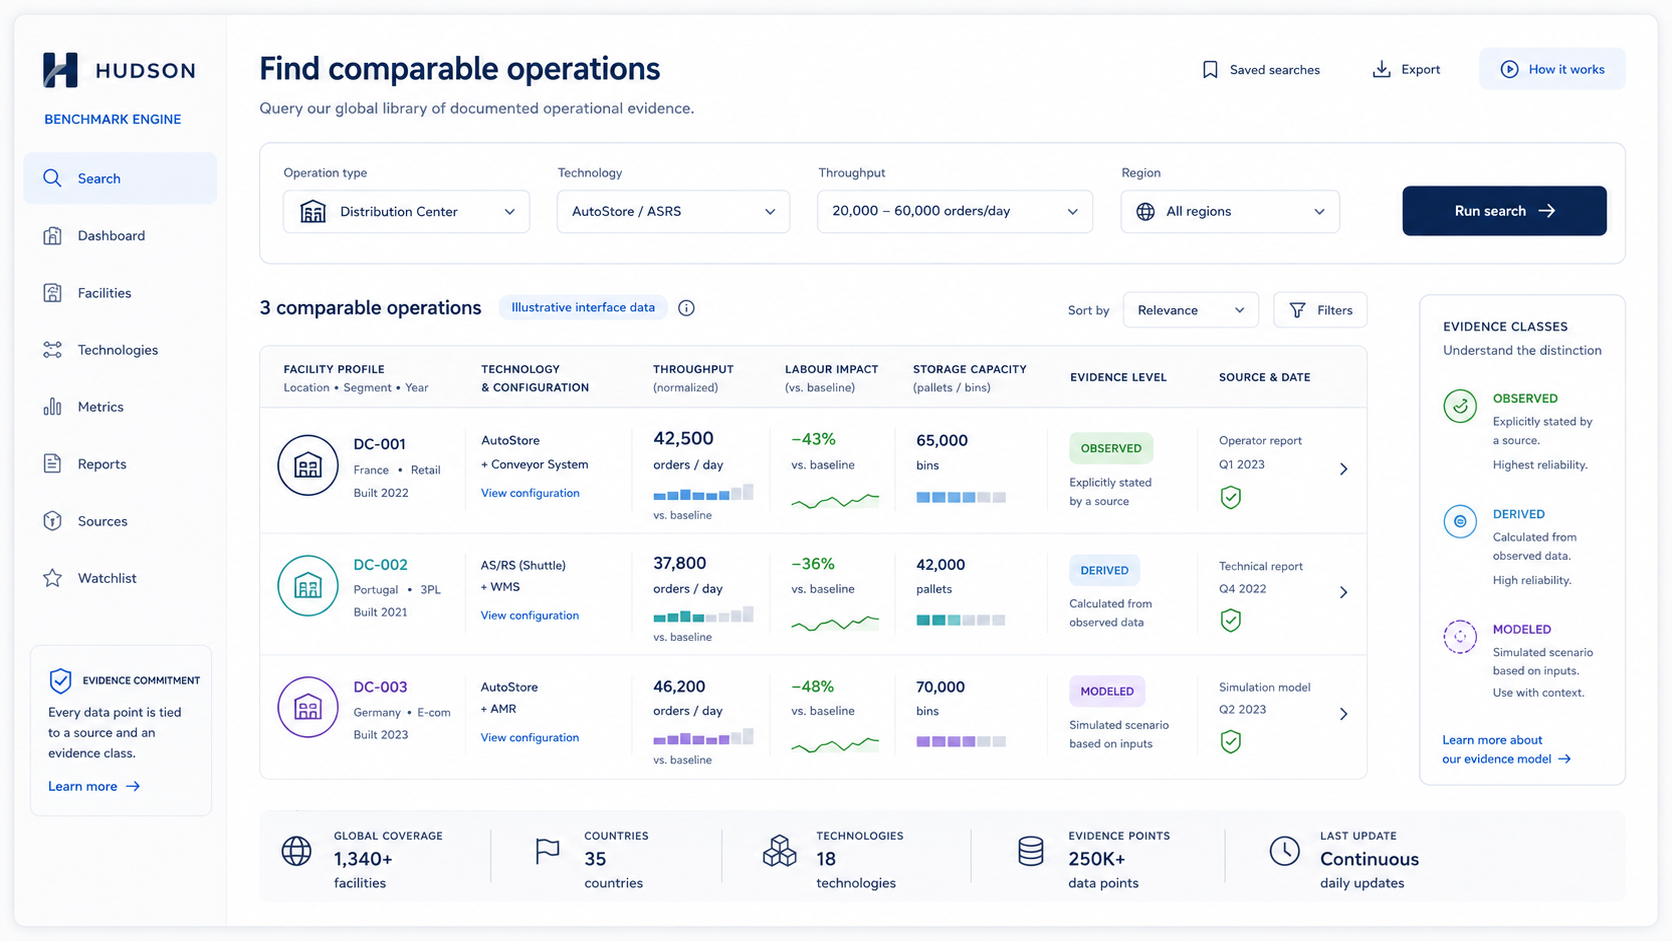
HUDSON is designed to compare the operation behind the company name. A relevant reference may come from another industry or country when the operating characteristics are sufficiently close.

Compare operating profiles Scale, storage, throughput, flow and automation.
Geography and industry provide context, but physical operating characteristics can be more important when assessing whether a result is transferable.
Keep differences visible Comparability is classified rather than assumed.
HUDSON can distinguish comparable, partially comparable, not comparable and insufficient-context situations instead of presenting every reference as equivalent.
Use documented outcomes Published operational results remain linked to evidence.
A case may provide throughput, labour, capacity, accuracy or economic results. The benchmark should use only observations whose context and scope are sufficiently resolved.
Build targets from evidence A target is not simply copied from one facility.
The long-term objective is to build evidence-supported operating envelopes from several relevant observations rather than presenting one reference site as a universal model.
What can make two operations comparable?
Surface area, pallet positions, physical footprint and facility configuration help determine whether two operations operate at a similar scale.
Facility scale
Pallet, case, piece, fulfilment, storage, manufacturing logistics or mixed flows can produce very different operating constraints.
Flow structure
Throughput must be compared using compatible units and scopes: warehouse total, subsystem, line, process or equipment are not interchangeable.
Throughput
Headcount alone is rarely enough. Shift structure, operating hours and output per labour unit provide more meaningful comparison.
Labour model
AS/RS, AMR, AGV, goods-to-person, conveyors, sortation, WMS/WES and other interventions can materially change the operating model.
Automation
Geography, temperature regime, facility type, industry constraints and operating environment remain relevant context even when other characteristics match.
Operating context
Industrial evidence review and warehouse documentation
Trust layer

Every number should have a history.

HUDSON distinguishes what a source actually reports from what is subsequently calculated, estimated or simulated.

Click or hover over each evidence class to see the distinction.

OBSERVED Explicitly stated by a source.
Example: a source explicitly states that a system handles 450 pallets per hour. HUDSON records the value, unit, scope, source and evidence quote.
DERIVED Calculated transparently from observed values.
Example: if headcount and daily orders are both documented, HUDSON may calculate a labour requirement per order. The calculation remains labelled DERIVED.
ESTIMATED Modelled from available evidence.
An estimate is not presented as a published fact. Its assumptions and available supporting evidence should remain visible.
SIMULATED Scenario-specific output.
Simulated values answer a scenario question. They represent a modelled possibility rather than an observation from an operating facility.
Quantitative layer

Measure the operation first.

HUDSON prioritises operational metrics that can be documented, normalized and compared with sufficient context.

Throughput Physical output

Pallets/hour, orders/hour, picks/hour, lines/hour, units/hour and parcels/hour.

The scope matters. 500 pallets/hour for one AS/RS subsystem is not automatically equivalent to 500 pallets/hour for an entire warehouse.
Productivity Labour performance

Output/operator, orders/FTE, picks/FTE, labour reduction and hours saved.

Productivity becomes more useful when the database also retains operating hours, shifts, process scope and whether a change represents reduction, avoidance or redeployment.
Capacity Storage performance

Pallet positions, storage density, bin locations and capacity increases.

Capacity data can later support derived ratios such as positions per square metre or investment per pallet position when the underlying values are verified.
Operations Process performance

Cycle time, picking time, accuracy, lead time, uptime and error rate.

Operational performance is not limited to speed. Quality and reliability measures can explain why two systems with similar throughput produce different outcomes.
Economics Investment performance

CAPEX, ROI, payback, annual savings and operating cost.

Economic values are especially valuable when they can be connected to physical operating results, while preserving currency, period and project scope.
Derived Comparable ratios

Cost/order, cost/pick, cost/pallet, labour/unit and CAPEX/capacity.

These ratios are potentially one of HUDSON's strongest layers, provided they remain explicitly marked as calculations derived from verified observed inputs.

HUDSON

Better evidence.
Better benchmarks.
Better decisions.

HUDSON Global Optimization Database is building a structured global evidence layer for warehouse, logistics and industrial operations.

Coverage varies by geography, industry, technology and metric. Benchmark outputs depend on the quantity, quality, scope and comparability of available evidence. A collected source is not automatically a validated benchmark.